Cloud BPA Findings
Cloud BPA (aka Best Practice Assessment) Findings refer to potential weaknesses, misconfigurations or deviations from best practice standards detected during Cloud BPA scans. SP360 helps identify, categorize, and track these findings across connected cloud environments, allowing users to review and address security posture issues systematically.
The Cloud BPA Findings page provides a centralized view of findings (i.e., active, fixed or ignored) uncovered within connected cloud environments. Once an environment is connected and the applicable standards or benchmarks are selected, SP360 runs an initial scan and then continues to run periodic scans to identify areas where the environment may not align with the selected best practice standards.
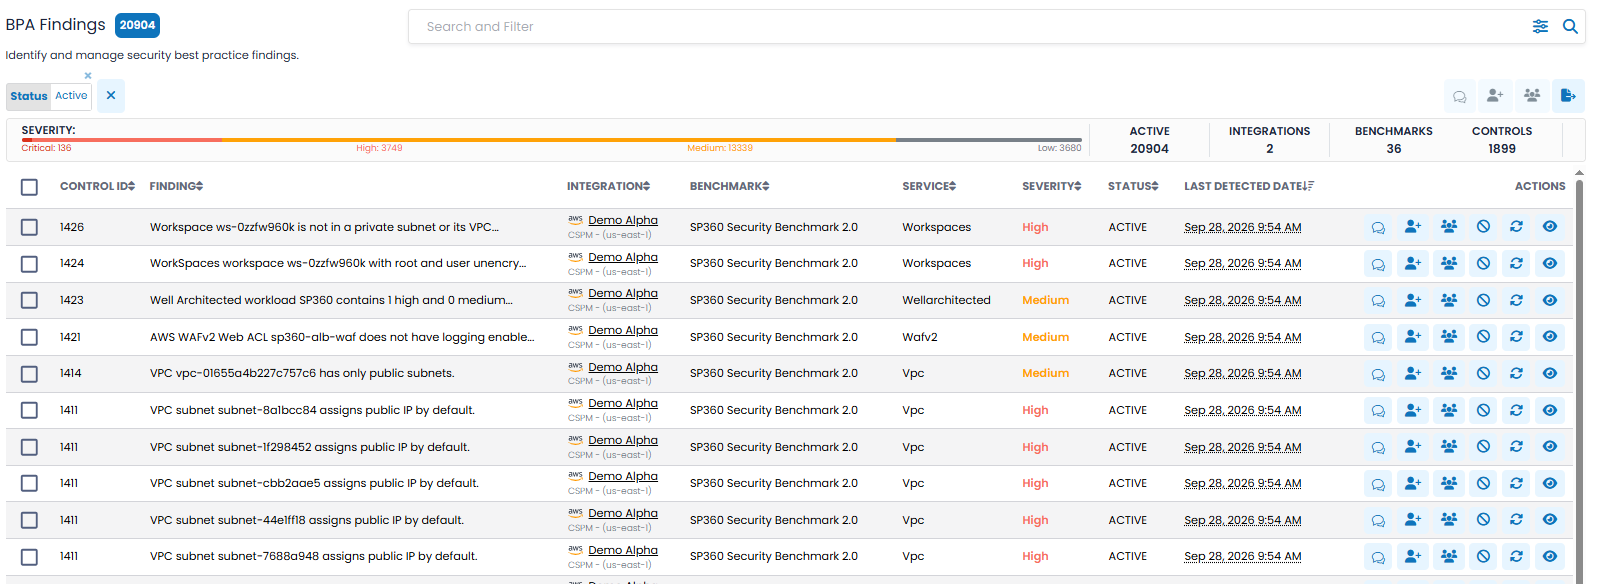
The upper left corner of the Cloud BPA Findings page contains a blue box with the number of findings meeting your current selection criteria, as shown below.
Filtering and Searching Options, and Action Icons
To the right of the Findings count, the BPA Findings page includes a Search and Filter control followed by four bulk action icons.

The Search and Filter control allows you to select and filter findings based on the attributes defined below.
| Filter Type | Definition |
|---|---|
| Integration | Each environment to be scanned needs to be “integrated” with SP360 . This filter allows you to filter Findings by a specific Cloud BPA integration. The dropdown is populated with the integrations currently configured in SP360. This is useful when multiple cloud environments or accounts are connected and you want to focus on Findings associated with one or more integrations.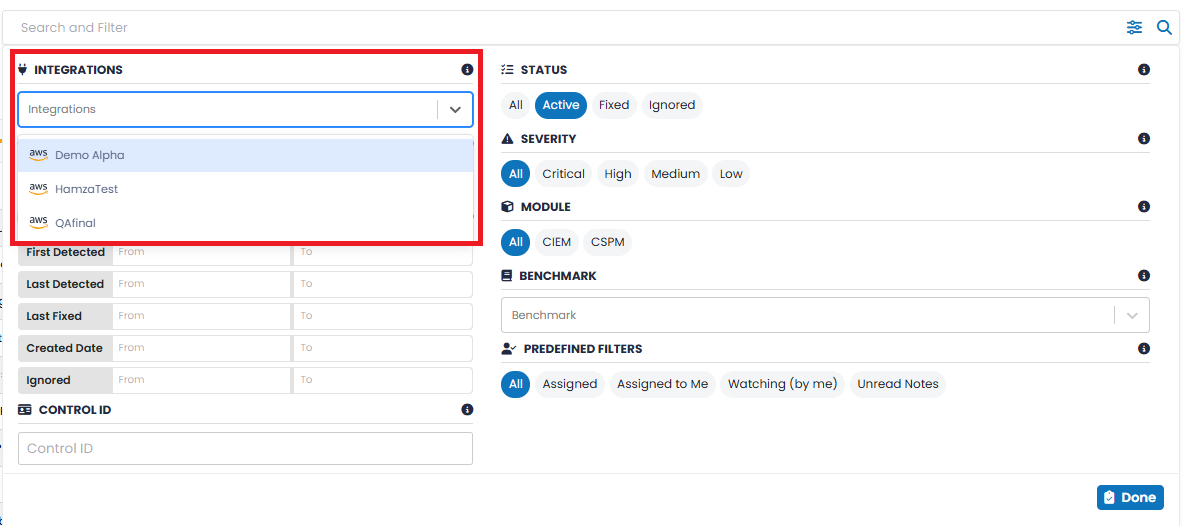 |
| Region | Cloud providers (e.g., AWS or Azure) have data centers in different regions, and their clients subscribe for these cloud services in different regions. This filter allows users to filter findings by the cloud provider’s region (i.e., where their data center is located). This is useful when reviewing findings associated with one or more regions or when prioritizing remediation by region.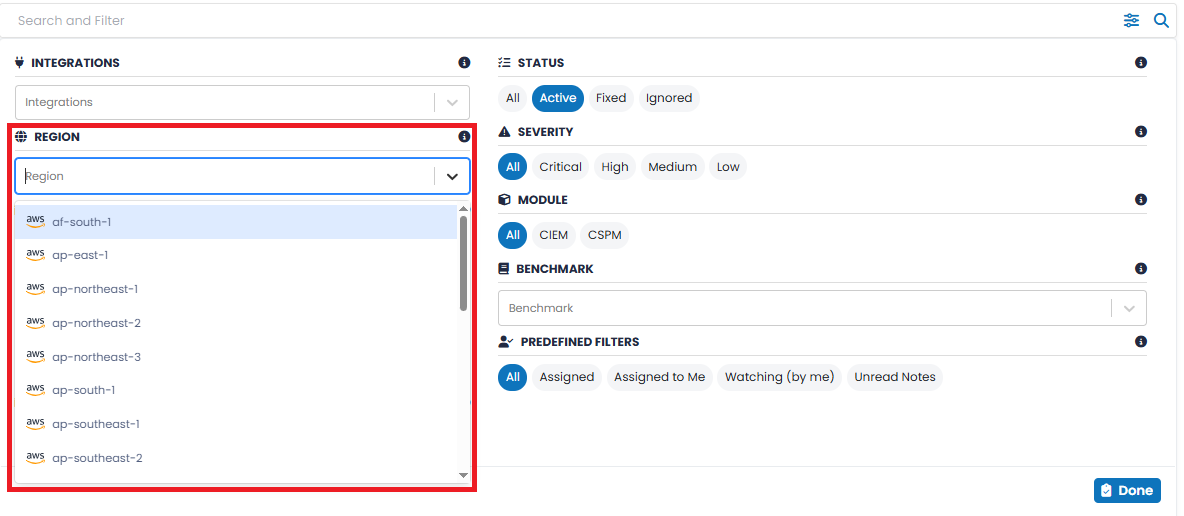 |
| Filter by Date | Allows you to filter Findings by date and timestamp ranges. Available date filters include First Detected, Last Detected, Last Fixed, Created Date, and Ignored. A From and To date can be specified for each applicable filter. If no From date is provided, the default is the beginning of time”, that is, the earliest date we started collecting data. If no To date is provided, the default is “now”, the latest date we collected data.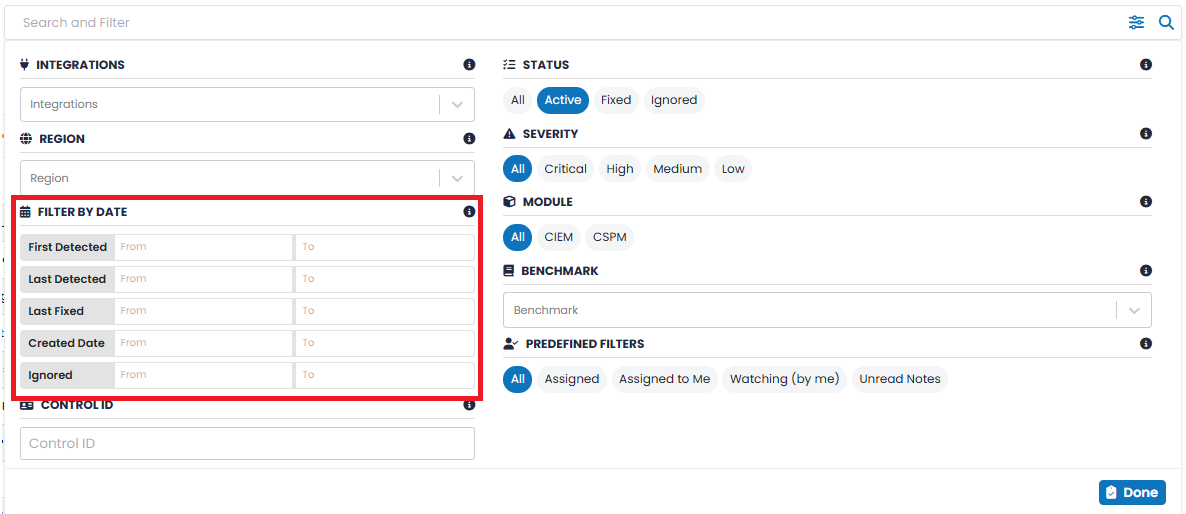 |
| Control ID | Controls are entities (e.g., settings, configurations) scanned and tested for. Findings are the results of those tests. Control IDs uniquely identify the related findings. This filter allows you to search for Findings associated with one or more Control IDs.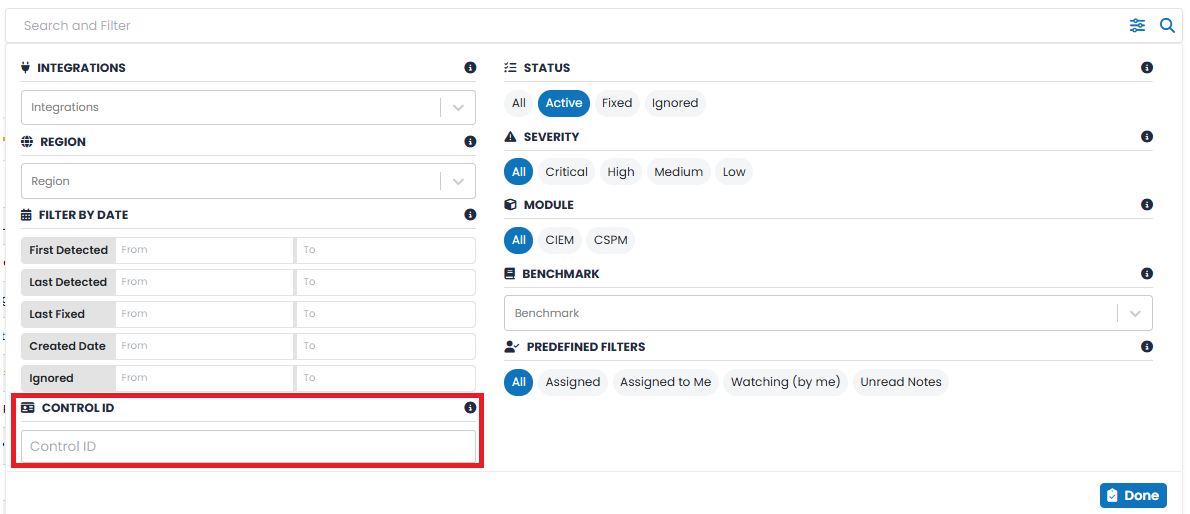 |
| Status | Allows you to filter Findings by their current status. Available options are All, Active, Fixed, and Ignored. This helps distinguish unresolved findings from those that have already been addressed or intentionally ignored.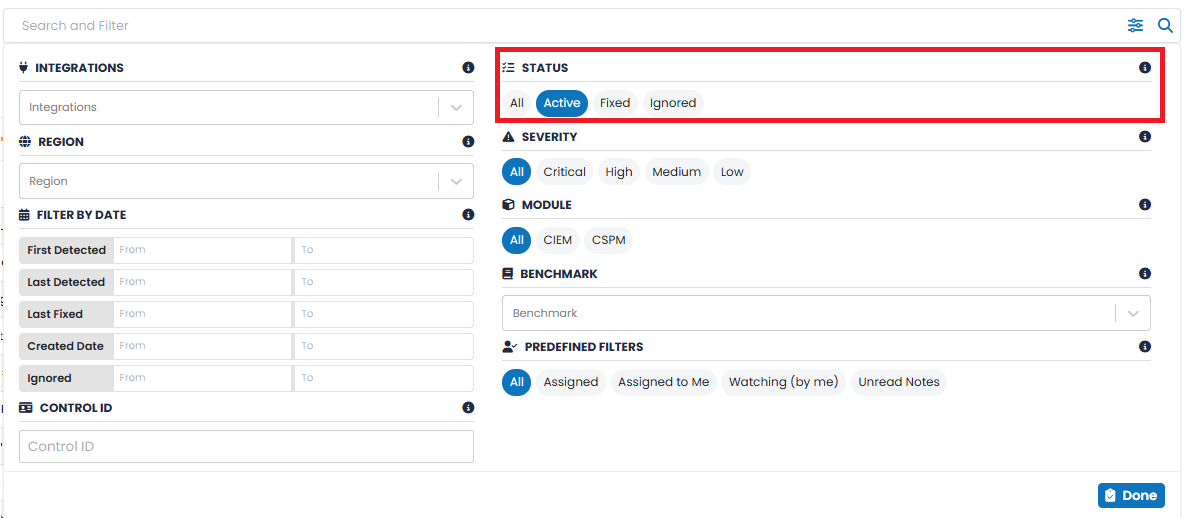 |
| Severity | Allows you to filter Findings by severity. Available options are All, Critical, High, Medium, and Low.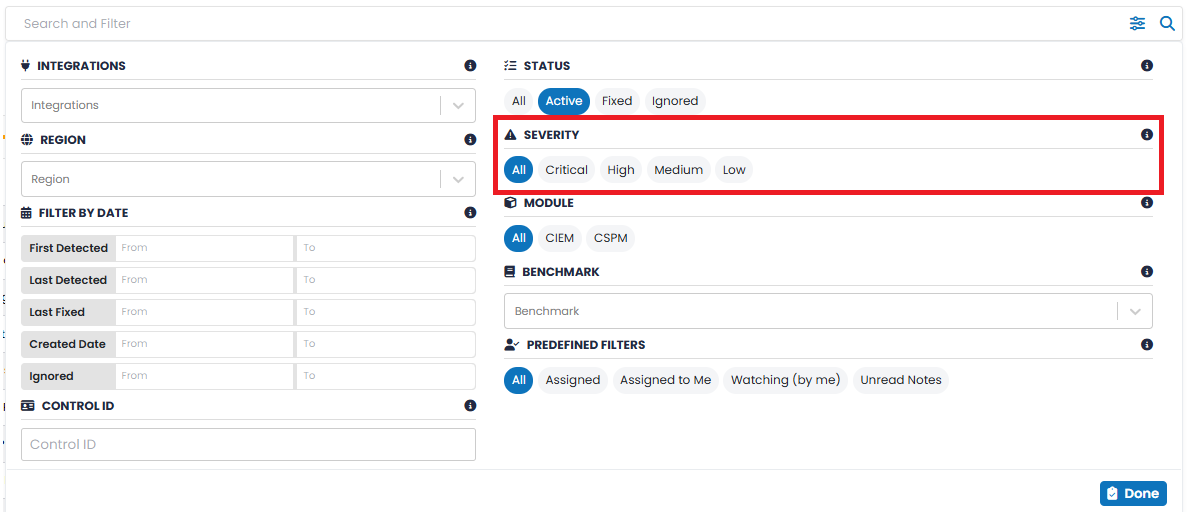 |
| Module | A module is a related set of Controls that together support industry security standards such as CIEM (Cloud Infrastructure Entitlement management) or CSPM (Cloud Security Posture Management). This filter allows you to filter Findings according to the Cloud BPA module. Available options are All, CIEM, and CSPM. Additional Cloud BPA Modules will be added in the future.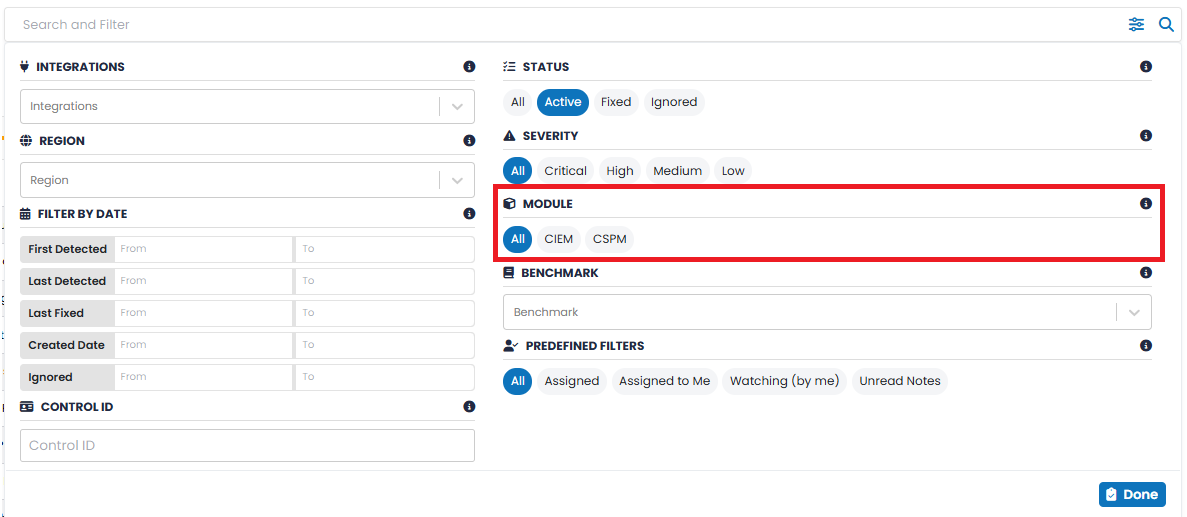 |
| Benchmark | Similar to Modules, Benchmarks are sets of related Controls. They are subsets of a given Module that focus on specific Cloud services (e.g., storage, CPU, etc.). This allows you to filter Findings by Benchmark. The dropdown is populated with whichever Benchmarks are present in the Finding data.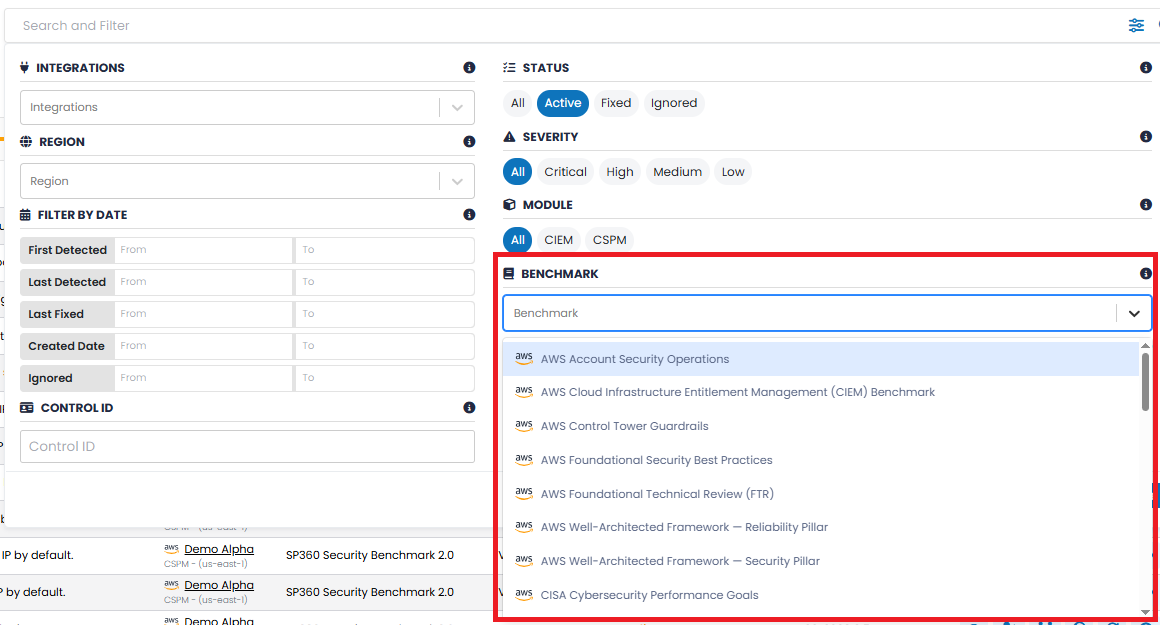 |
| Predefined Filters | For ease of use, the Predefined Filters option allows you to display Findings matching commonly used criteria. Available options are All, Assigned, Assigned to Me, Watching (by me), and Unread Notes.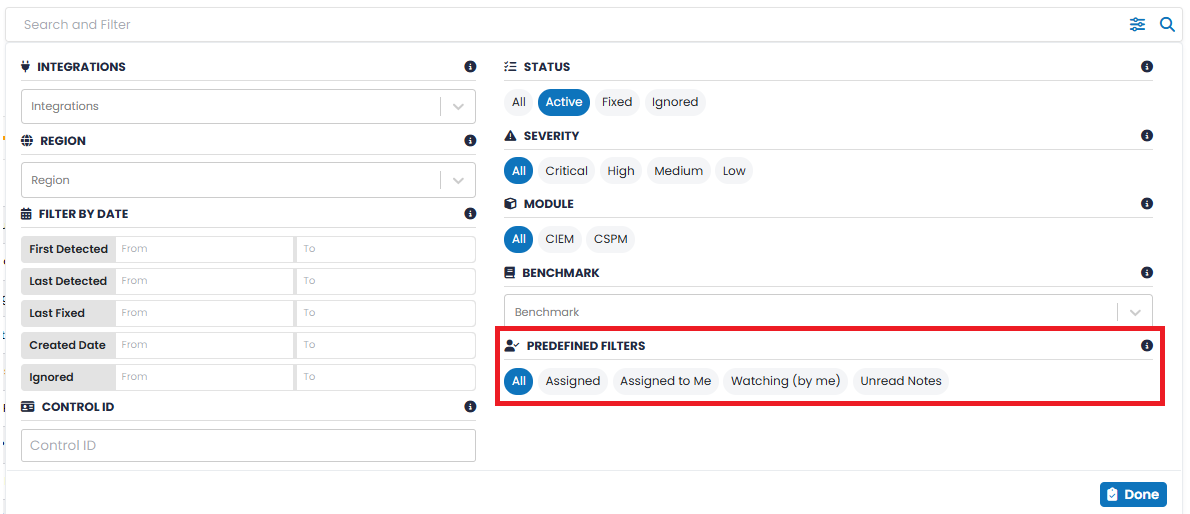 |
Applied filters are displayed above the Findings grid and can be removed individually when they are no longer required.
Note: Not all filtering options may apply to every Module, Benchmark, Integration, or other selection. Available filter values may change based on the Finding data that matches the criteria already selected.
Action Icons (Bulk Operations)
The checkboxes on the left of each finding row allow users to select one or more findings and apply bulk operations to them. For example, assign the selected set to the same person. The blue box before the “Selected” control (which only appears when one or more findings are selected) shows the number of findings selected and that will be impacted by any bulk operation.
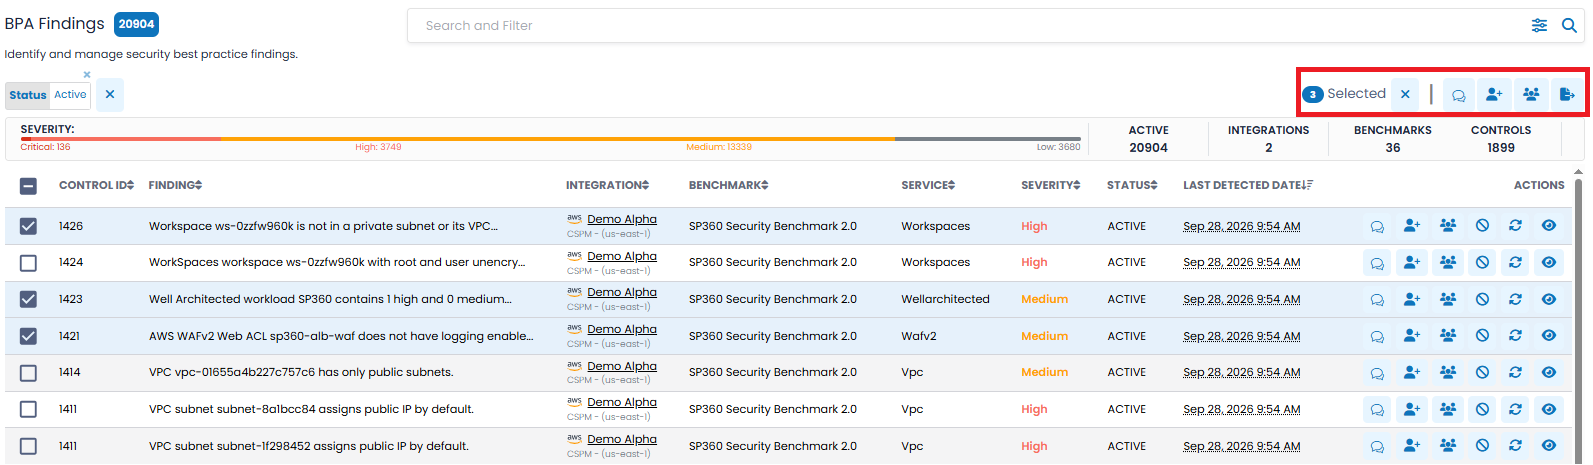
There are four bulk actions 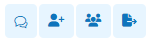 available:
| Action Icons | Function |
|---|---|

|
Clicking this icon results in marking all notes as read for selected findings. |

|
Clicking this icon displays the Assign/Unassign pop-up, shown below. This allows the user to:
This in-line assignment feature streamlines task ownership and simplifies tracking of BPA Findings. 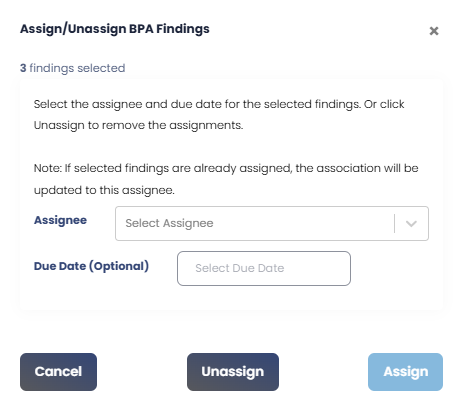
|

|
Clicking this icon displays the Manage Findings Watchers pop-up, shown below. Users can select one or more team members from the drop-down list to assign or unassign as watchers for all selected Findings. The available controls allow you to Assign Watchers, Unassign Watchers, or Unassign All Watchers. Watchers will be notified of any updates to the selected findings, including notes, status changes, or reassignments. 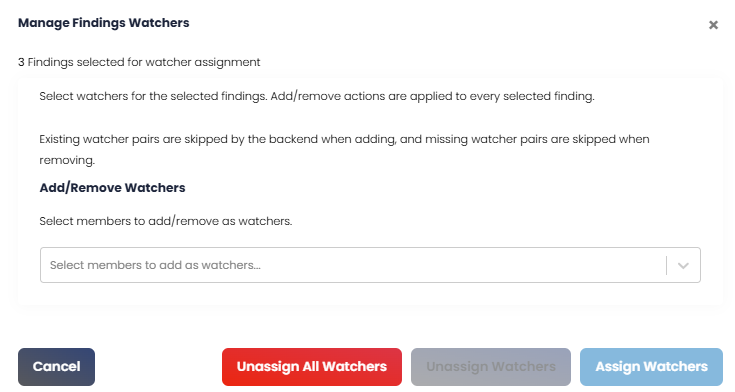
|

|
Clicking on this icon downloads (in CSV format) all details for all/selected findings |
Cloud BPA Findings Insights Bar
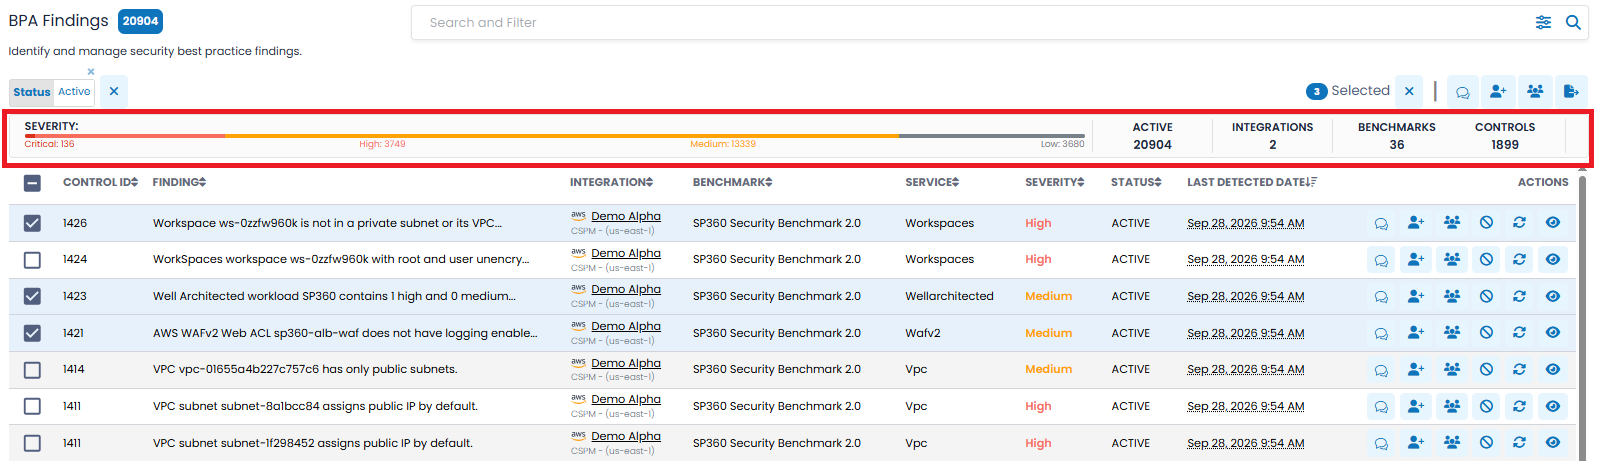
The Cloud BPA Findings Insights Bar provides a high-level summary of current BPA Findings based on the current filter selections. It helps users quickly assess the volume, severity, and scope of findings across their selected cloud environment, region, integration, benchmark, or module.
The insights bar includes a Severity visual indicator, followed by several numerical summary tiles.
Severity Bar
The Severity bar categorizes active Cloud BPA findings by severity level. Each segment is color-coded and labelled with the corresponding count of findings, enabling users to quickly understand which findings may require the most immediate attention.
The severity levels shown are:
- Critical – Priority findings that require immediate attention.
- High – Significant findings that should be reviewed and addressed promptly.
- Medium – Moderate-priority findings that should be reviewed as part of planned remediation.
- Low – Lower-priority findings that may still require review or tracking.
This breakdown allows users to prioritize Cloud BPA findings, based on risk level, and focus remediation efforts on the most important issues first.
Summary Tiles
To the right of the Severity bar are key numeric indicators that provide additional context for the findings currently displayed.
- Active – Total number of findings currently Active based on the selected filters.
- Integrations – Number of cloud integrated environments represented in the current finding results.
- Benchmarks – Number of benchmarks represented in the current finding results.
- Controls – Number of unique controls represented in the current finding results.
These summary counts update based on the filters applied, helping users maintain a real-time overview of the Cloud BPA findings most relevant to their current focus area.
Cloud BPA Findings Grid
The Cloud BPA Findings grid provides a tabular view of individual findings identified during Cloud BPA scans. The findings grid includes the following fields, by default, however, users can customize the grid to add, remove, or re-arrange fields to meet their needs by clicking the  action icon at the bottom right, explained here.
Each row represents a specific finding associated with an integrated cloud environment, benchmark, service, and control. The grid allows users to review the finding details, understand its severity and status, identify ownership, and take row-level actions directly from the Findings page.
Each row in the grid is structured into the following columns:
| Column Header | Definition |
|---|---|
| Control ID | Displays the unique control identifier associated with the finding. There is a one-to-one relationship between Control IDs and Control Descriptions (aka Findings) . This helps users trace the finding back to the relevant benchmark or best practice control. |
| Finding | Provides a brief description of the issue detected during the Cloud BPA scan. The finding text may be truncated in the grid when the description is long, Hover over the text to view the full finding description. |
| Integration | Shows the integrated cloud environment where the finding was detected. This includes the integration name and related cloud account or region details when available. |
| Benchmark | Displays the benchmark or best practice standard against which the finding was evaluated. |
| Service | Each cloud provider (e.g., AWS, Azure, etc.) provide a menu of services that can be subscribed to (e.g., AWS storage which is referred to as S3, Web Application Firewalls which is referred to as WAF, etc.). This field shows the specific Cloud Provider “cloud service (s)” associated with the finding, such as Workspaces, WAFv2, VPC, S3, Security Hub, or another evaluated service. |
| Severity | Indicates the severity level assigned to the finding, such as Critical, High, Medium, or Low. This helps users prioritize remediation. |
| Status | Displays the current status of the finding, such as Active, Fixed, or Ignored. |
| Last Detected Date | Displays the most recent date and time when the Finding was detected by SP360. |
| Actions | Row-level action icons, explained below. |
To learn more about the optional fields that can be added, removed, or re-arranged in the Integrations grid, click here.
Each Finding has six row-level action icons on the right side of each row.
| Icons | Description |
|---|---|
Add Notes |
Clicking on this icon displays a pop-up window where you can add, review, edit, or delete descriptive notes related to a finding’s status. 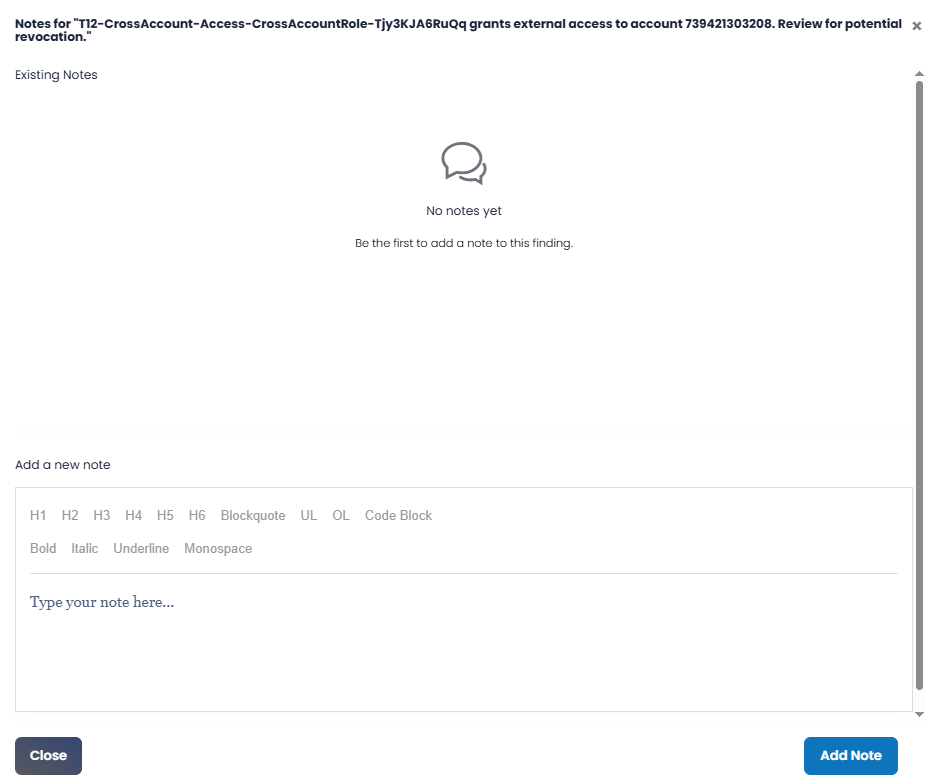
Note: Only the user who added a note can edit or delete it. If descriptive notes have been added for a finding, a superscript next to the icon will indicate the number of notes, as shown below. 
|
Assign/Unassign |
Clicking the row-level Assign/Unassign icon displays a pop-up window for the selected finding, shown below. This functionality allows the user to:
This in-line assignment feature enables quick task delegation directly from the grid – without needing to use bulk actions – and helps streamline tracking of BPA Findings.
|
Add/Remove Watchers |
Clicking on this icon allows you to add multiple users (one-by-one) as watchers for a given finding. The window displays the Finding details and any Current Watchers. To add new watchers, select one or more team members from the drop-down list under Add New Watchers and click Assign Watchers. Current watchers are not included in the list of users available to add. Existing watchers can also be selected and removed from the Finding. 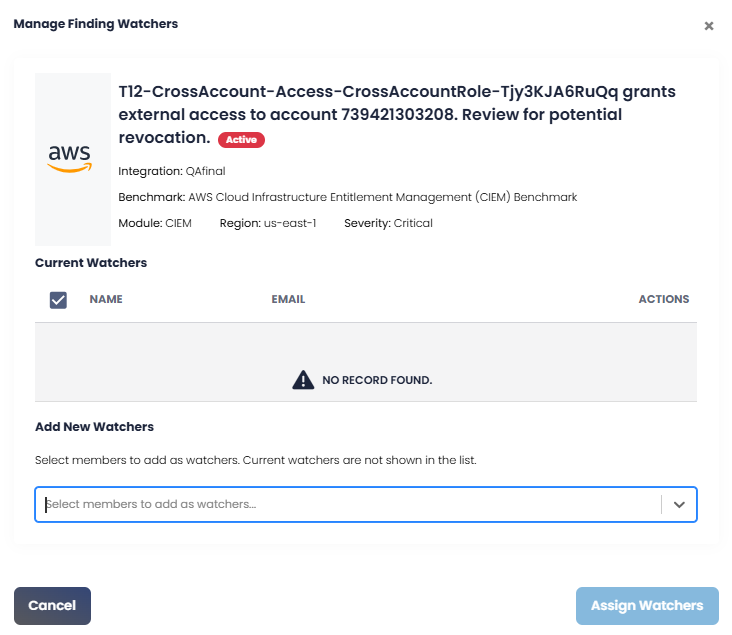
|
 Ignore Finding |
Clicking this icon opens the Ignore BPA Finding pop-up window. Users can choose Single Ignore to ignore only the selected instance of the Finding, or Bulk Ignore to ignore all instances of that Finding for the applicable integration. A Comments field is provided to document the reason or business context for ignoring the Finding. Click Ignore to complete the action. 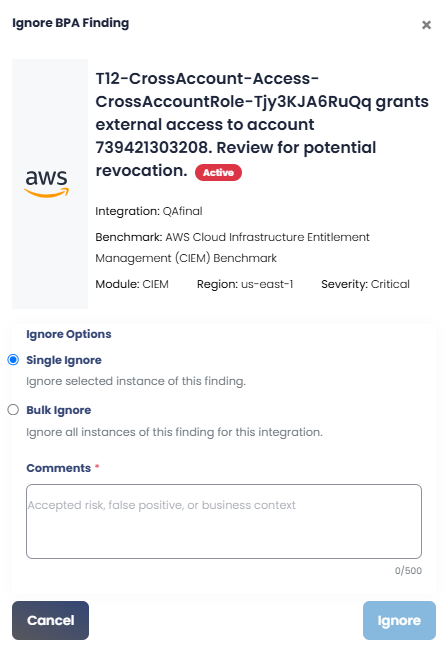
|
 Re-evaluate Finding |
Clicking this icon opens the Re-evaluate Finding pop-up window, which displays key information about the selected Finding. Clicking Re-evaluate Finding queues a new evaluation scan for that specific Finding so SP360 can determine whether the issue is still present. 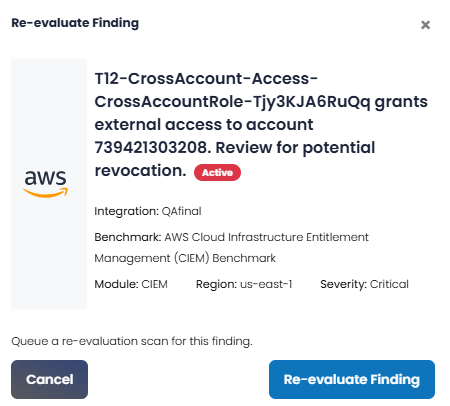
|
 View Details |
Clicking on this icon displays a pop-up window with additional details related to the Finding, as shown below. The Finding Details page provides key information to help users understand and resolve the Finding. The information is organized into five tabs, one of which is shown below. 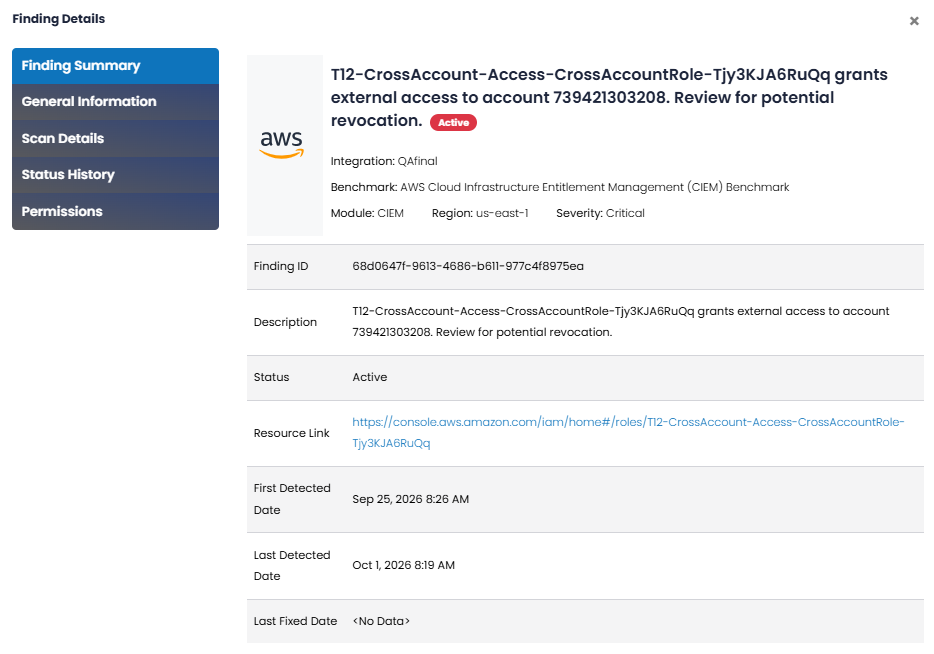
|