Dashboard Overview

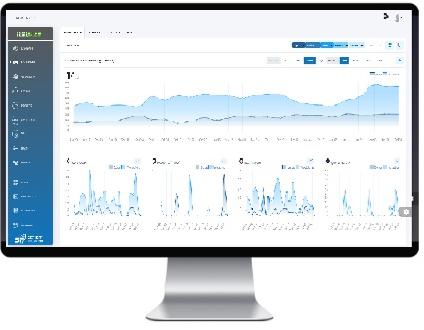
The SP360 Dashboards offer significant functionality and continuous monitoring capabilities for both Vulnerability Management and Policy Compliance. They provide deep insight into your organization’s security posture – both in terms of identified vulnerabilities and alignment with regulatory compliance standards. Each dashboard includes numerous filters to help you configure your view and focus on the information that matters most. The dashboard features include, but are not limited to:
- Vulnerabilities Trending History – illustrates new vulnerabilities, total number of vulnerabilities, reopened vulnerabilities, fixed vulnerabilities, and ignored vulnerabilities.
- Current Vulnerabilities (i.e., current counts) – partitions the vulnerabilities by various attributes such as severity or commonality.
- Vulnerability Metrics – “Severity-based” and “Timeband-based”, enables you to see how the pace at which your organization is keeping up with the vulnerabilities. If your organization has established SLAs, if you are meeting them.
- Compliance Trending History – visualizes pass/fail compliance performance over time, across selected policy frameworks.
- Current Compliance Findings – summarizes failed controls by severity and category, with insights into top failing policies, technologies, and control domains.
- Asset Lists – Each dashboard includes a list of all contributing assets (e.g., Cloud Agents, Endpoints, etc.), which can be filtered to refine your view of the data.
SP360 continues to empower its clients to monitor evolving risk landscapes – highlighting both critical vulnerabilities and compliance gaps – while enabling fast, data-driven remediation. Because SP360 scans multiple resource types and supports a growing number of audit standards, there is a dashboard for each major class, including Cloud Agents, Endpoints, Web Applications, SAST (Static Code Analysis) and Policy Compliance.
To learn more about each of the dashboards and the features they offer, click on the links below.
Dashboard Overview

The SP360 Dashboards offer significant functionality and continuous monitoring capabilities for Vulnerability Management. They offer deep insight into your organization’s vulnerabilities, as well as how well your organization has been addressing these vulnerabilities, via numerous filters used to configure your view into your vulnerability data in order to see just the information that is most important to you. The dashboard features include, but are not limited to:
- Vulnerabilities Trending History – illustrates new vulnerabilities, total number of vulnerabilities, reopened vulnerabilities, fixed vulnerabilities, and ignored vulnerabilities.
- Current Vulnerabilities (i.e., current counts) – partitions the vulnerabilities by various attributes such as severity or commonality.
- Vulnerability Metrics – “Severity-based” and “Timeband-based”, enables you to see how the pace at which your organization is keeping up with the vulnerabilities. If your organization has established SLAs, if you are meeting them.
- Asset Lists – On each dashboard, all the assets (e.g., Cloud Agents, Endpoints, etc.) that contribute to the vulnerability data are listed, and they can be manipulated to alter your view into the data.
SP360 continues to empower its clients to see the vulnerabilities trend as they evolve, with precise attention paid to those with the highest priority. As SP360 is capable of scanning several different resource types, there is a dashboard for each class which includes Cloud Agents, Endpoints, Web Applications, and SAST (sometimes also referred to as Static Code Analysis).
To learn more about each of the dashboards and the features they offer, click on the links below.